A fresh approach to data
in the face of climate and social challenges
An approach where data highlights the impact of transport plans on citizens, and ensures equal access to resources.
A visual and interactive approach that allows everyone to understand and create transport scenarios based on reliable data.
An open approach to more effectively integrate public transport with other sustainable forms of transport, including car-sharing, cycling, and self-service bikes and scooters.
Your data observatory for multimodal mobility
Knowledge management
Identify coordination problems between buses, trains, trams, self-service fleets, etc.
See all options in one place
You can identify missing or inconsistent data thanks to a visual interface that groups all mobility options.
Coordinate the different multimodal options
You can better detect gaps, duplications and inter-modal disconnections. You can also visualise underserved areas.
Analyse connections and routes
Study waiting times, disruptions, travel times, etc., in relation to the relevant population.
Uses citizen-centric indicators
In addition to network indicators, you can measure the system's impact on quality of life and the environment.
Decision support tool
Simulate new scenarios and test their impact on citizens
Create your multimode scenarios
Import your data to model mobility options that combine different forms of sustainable transport.
Test multiple hypotheses
On the interface you can modify the lines, stations, terminals and frequencies, and immediately measure the benefits.
Anticipate impact
Compare the strengths and weaknesses of each scenario, and measure affected populations neighbourhood by neighbourhood.
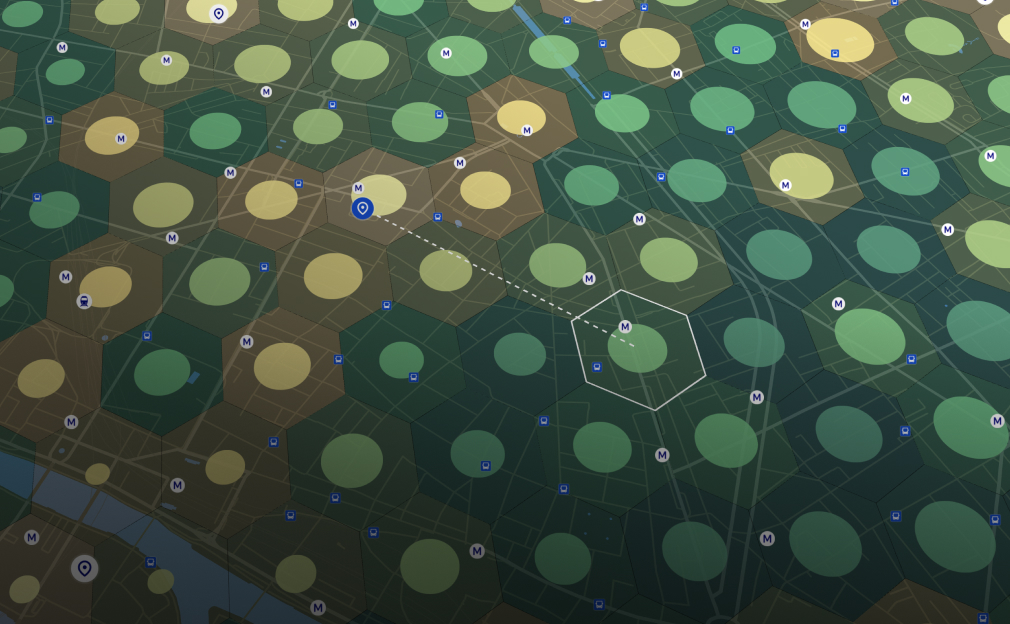
Calculate a score that rates how easily areas can be accessed
Generate isochrone maps and accessibility maps by combining different networks.
Consensus and confidence
Facilitate discussion and collaboration between mobility players
Save time in the preparation of diagnostics
Carry out your own strategic studies, independent of GIS teams or consultants.
Share a comprehensive view of offers
Evaluate the overall performance of all transport options thanks to meaningful visualisations, interactive maps and synthetic indicators.
Clearly communicate your plans
Use interactive demonstrations connected to the data to describe supply, demand and the population.
Reach consensus faster
You can quickly test each new scenario idea and clearly present its strengths and weaknesses.
Explore Modality: Discover our case studies
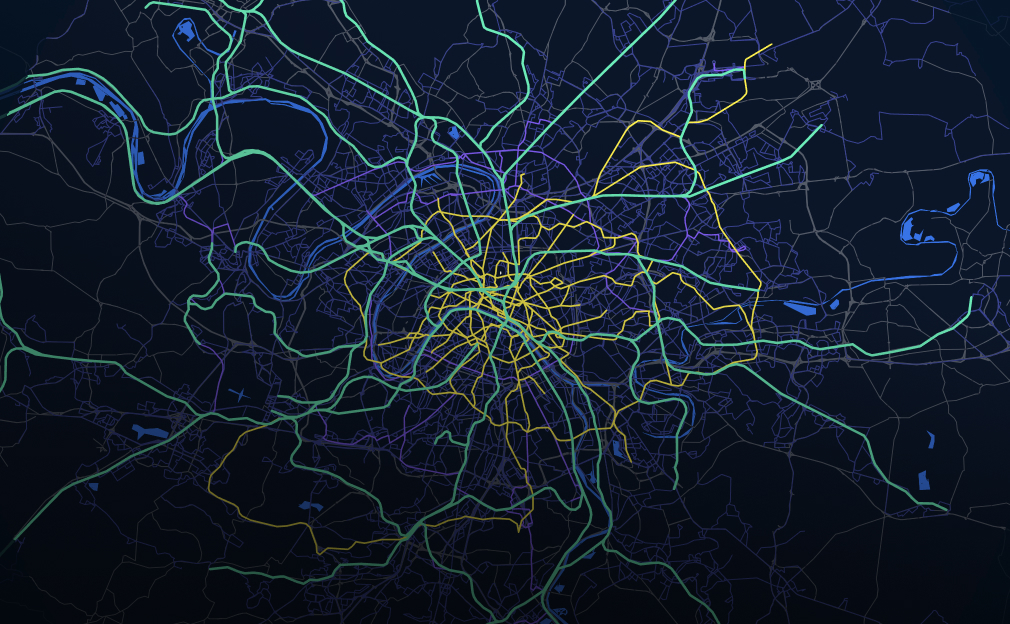
Grand Paris 2021 vs 2030
Thanks to Modality, we have shown how the new lines of the Grand Paris network will improve access to the area for nearly 5 million inhabitants.
Discover

Acces to jobs
There are great inequalities in access to places with a high density of jobs: we calculate it and visualize it thanks to the interactive maps of Modality.
Discover
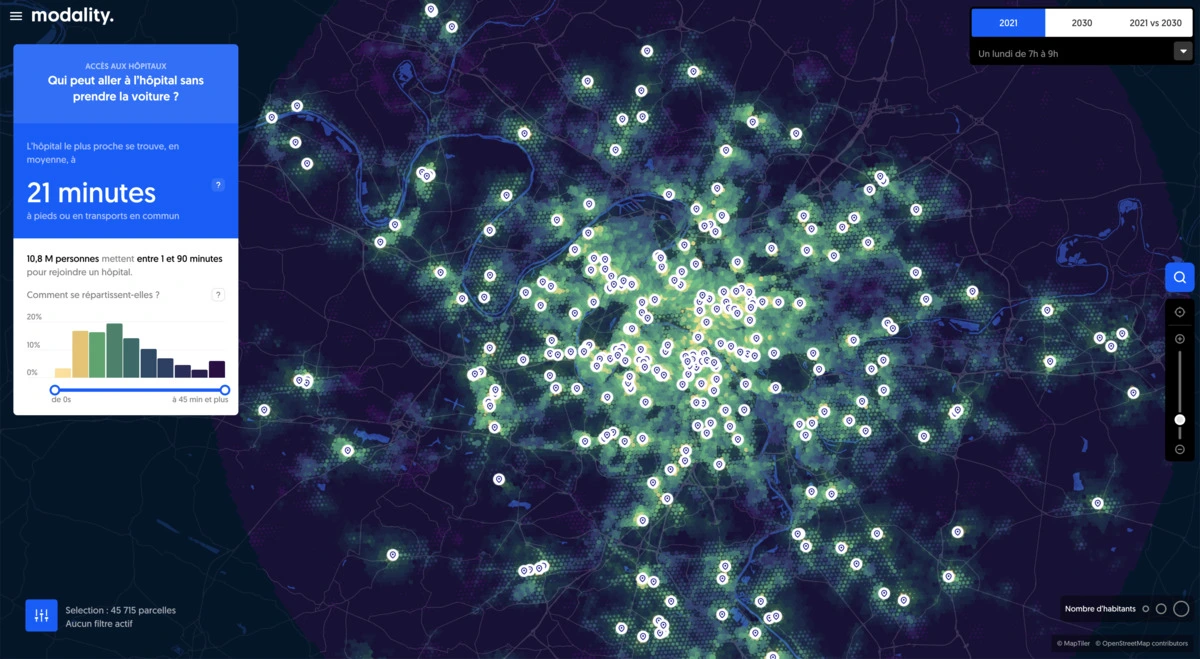
Access to health
Who can get to a hospital without taking their car? We visualize how long it takes to go to the nearest hospital, by public transport, according to the place of residence, thanks to Modality.
Discover
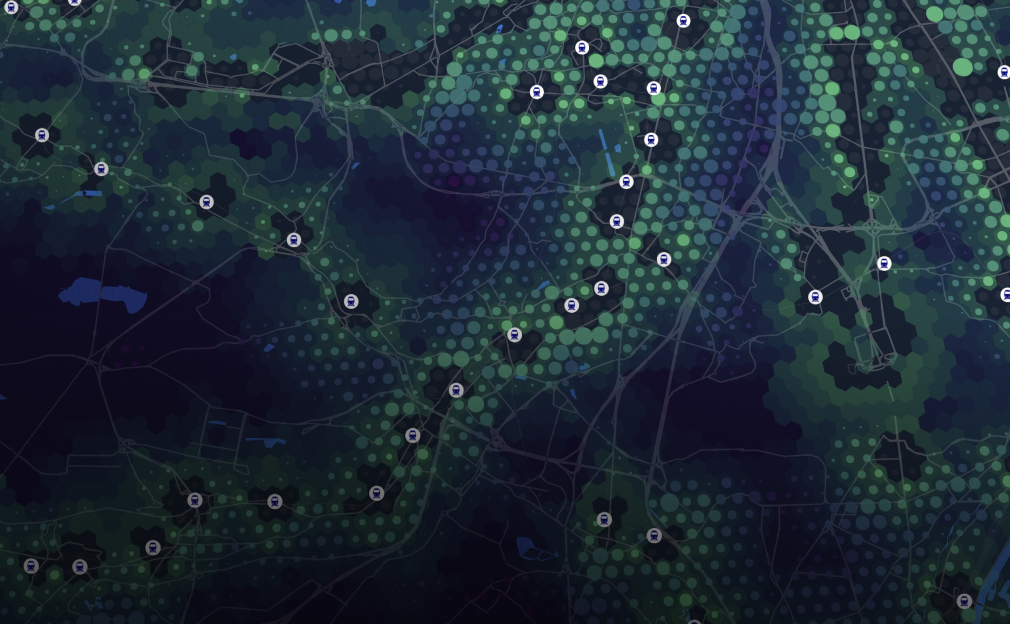
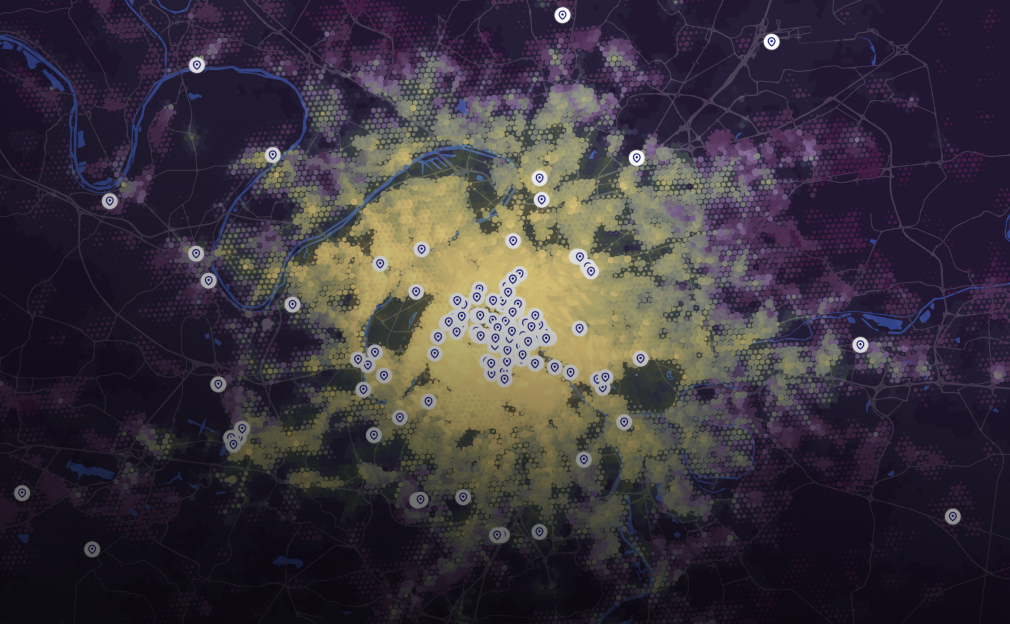
Zones with little or no coverage
With Modality, we map the people excluded from the network: populations who cannot reach a metro, tram or train station on foot from their place of residence.
Discover
Tourist sites
To identify where to develop tourist accommodation, we calculate for each neighborhood access scores to the most visited tourist sites in Île-de-France, with Modality.
Discover
How are you going to use Modality?
Operators
- TendersPrepare and support demanding responses.
- Redesign of a networkEvaluate and communicate the impact of changes.
- Coordination train - bus - cyclingLink public transport options to self-service bicycle and scooter networks.
Local transport authorities
- Diagnose and identify problemsIdentify problems with coordination and target white zone populations.
- Mobility planModel your mobility scenarios and impact.
- Data observatoryMeasure the service provided by each line and operator.
Cities & communities
- Potential for soft mobilityEstimate the potential of marrying public transport with soft mobility.
- Citizen dialogueBring transparency and interactivity to community debate.
- Making the most of open dataMake the most of open data to enrich your diagnostic and decision-making tools.
Urban planners
- Mobility surveysView the results of your commuter surveys.
- Isochrone mapsDefine categories for a population based on quality of access criteria for the area.
- Networking the territoryCheck that cultural, sports and educational facilities are accessible to all
Who's behind Modality?
Modality is a software component edited by Dataveyes, a studio that specialises in human-data interactions.


At Dataveyes, we have been working for 10 years with major players in European transport.
We saw the potential of data to design mobility that's adapted to the challenges of tomorrow's cities.
We also saw obstacles preventing this data from getting into the hands of all businesses. These include siloed approaches, too complicated tools, network-centric KPIs, static PDFs and Powerpoint presentations disconnected from data, etc.
With Modality, we want to facilitate the use of data for the benefit of all citizens.


Modality helps to visualise, identify and coordinate alternatives to the personal car in any given area.